
Tags
Cartesian product, computer code, Japanese multiplication method, math, multiplication, Pillow (PIL fork), Python code
On my regular blog I just posted about a Japanese visual multiplication method. It’s a cute trick that ties into the notion of grid multiplication techniques. (In general, multiplication techniques are of some interest due to the Mandelbrot set, which requires multiplying large numbers lots of times.)
It turns out code to generate the patterns was a lot easier than I thought it would be. The hardest part was generating the diagonal summing lines.
Here’s an example of the output:
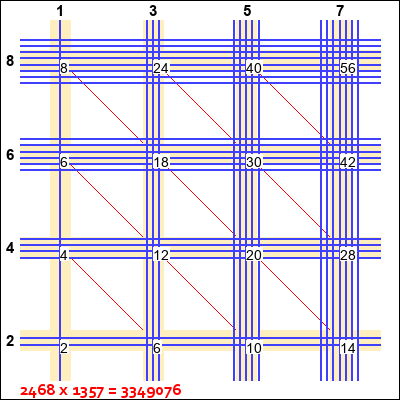
The image above illustrates multiplying 2468 × 1357 using the Japanese base one visual method. (It’s base one in that each digit is represented by as many lines.)
The first number, 2468, runs along the left from bottom-to-top; the second number, 1357, runs along the top from left-to-right. Think of the multiplication as laid out from the lower-left, up to the upper-left, then over to the upper-right.
At the crossing of each pair of digits is a group of lines intersecting (16 groups in the image above). The number of line intersections in each group is its count — which is shown for each group.
Beige bands indicate “roads” where digits intersect. Each crossing is an intersection group. (So, the road crossings form a Cartesian product of the two factors.)
Thin red lines are the summation diagonals. They are in a sense the output digits. Each diagonal sums the group counts along its length. Note that the lower-left and upper-right corners each have an implied diagonal corresponding to an output digit. (There is also an implied carry digit on the far left.)
§
The algorithm requires both input factors have at least two digits. The inputs are strings, so leading zeros are just another digit. That means it is possible to illustrate single-digit multiplication.

But it leaves something to be desired given the three-out-of-four null groups. Note the beige roads have a darker line to highlight the zero count of that digit.
§ §
The surprise for me was how simple much of the code turned out to be. Here’s the first part, where we condition the input numbers (which are strings).
002| b_str = argv[2] if 2 < len(argv) else ‘1357’
003|
004| a_nbr = int(a_str)
005| b_nbr = int(b_str)
006| c_nbr = a_nbr * b_nbr
007|
008| # Need lists of digits…
009| a_digits = [int(ch) for ch in a_str]
010| b_digits = [int(ch) for ch in b_str]
011| a_len = len(a_digits)
012| b_len = len(b_digits)
013|
014| # Sanity check…
015| if a_len < 2:
016| raise ValueError(‘Two digit minimum! (%s)’ % a_str)
017| if b_len < 2:
018| raise ValueError(‘Two digit minimum! (%s)’ % b_str)
019| if 9 < a_len:
020| raise ValueError(‘Two digit minimum! (%s)’ % a_str)
021| if 9 < b_len:
022| raise ValueError(‘Two digit minimum! (%s)’ % b_str)
023|
The first step is to convert them to integer values. Doing this successfully means the input strings are value numbers and lets us generate the expected result value.
The second step is to convert the strings into a list of single digits, the length of which determines the rows and columns of our grid. (We’ll store those lengths in handy variables just to make all the coming references to it cleaner.)
§
Now comes the fun part. Each digit equates to a number of lines, as many as the digit’s value.
The easiest approach is to center the group of lines. That means a single line, or any odd number of lines, has a line directly on the center, but even numbers of lines straddle the center.
So, what we want, for each digit, is a list of offsets. We need to draw five lines for the digit 5, so a digit value of five must generate a list of five offsets. Five is odd, so those offsets center on zero.
If we’d like the lines to have a nominal separate of 1.0, it works out like this:
- [] (empty list)
- [0]
- [-0.5, +0.5]
- [-1.0, 0, +1.0]
- [-1.5, -0.5, +0.5, +1.5]
- [-2.0, -1.0, 0, +1.0, +2.0]
- [-2.5, -1.5, -0.5, +0.5, +1.5, +2.5]
- [-3.0, -2.0, -1.0, 0, +1.0, +2.0, +3.0]
- [-3.5, -2.5, -1.5, -0.5, +0.5, +1.5, +2.5, +3.5]
- [-4.0, -3.0, -2.0, -1.0, 0, +1.0, +2.0, +3.0, +4.0]
The actual line-spacing is factored (by a constant) when the image is drawn.
Here’s the code for generating the list of lists:
002| Func = lambda n: Span(n,–(float(n–1)/2.0))
003|
004| # Number of lines to draw…
005| a_nlines = [Func(d) for d in a_digits]
006| b_nlines = [Func(d) for d in b_digits]
007|
008| # Start location…
009| a_start = float(a_len–1) / 2.0
010| b_start = float(b_len–1) / 2.0
011| border = 7.0
012|
013| # Centerlines…
014| a_axis = [x*(border/a_start) for x in Span(a_len,–a_start)]
015| b_axis = [x*(border/b_start) for x in Span(b_len,–b_start)]
016|
Each list of digits generates a list of lists (a_nlines and b_nlines from a_digits and b_digits, respectively).
The meat is in the Func function (a singularly uncreative name, I grant you; sometimes finding the right name just takes too long). It takes a numeric value and returns a list of offsets, as many as specified by the input value. It delegates most of the work to the Span function (that name was kinda obvious).
The Span function takes a numeric value, n, and a beginning value, b. It just returns a list of n float values starting from b and increasing by one. The list of values is trivial — the trick in in calculating the start point.
The start location, along with the border and digit lengths, determine the two lists of center-lines, a_axis and b_axis.
§
All that remains is drawing the image.
I used the Python Pillow fork of the PIL package to create the PNG file. (I’d have to say I’m fan. I use it a lot!) It has drawing primitives, points, lines, rectangles, as well as text with fonts, so it’s pretty useful.
I have a wrapper class, Canvas, that creates a scaled drawing port. It allows me to use a coordinate system that matches the problem rather than one that matches the image. That class is too big to include here, but here’s the code that sets the values used:
002| xmin, xmax = float(–10.0), float(+10.0)
003| ymin, ymax = float(–10.0), float(+10.0)
004| view = ((xmin,xmax), (ymin,ymax))
005|
006| c_line = (0x3f, 0x3f, 0xff)
007| c_null = (0xdf, 0xbf, 0x7f)
008| c_road = (0xff, 0xef, 0xbf)
009| c_diag = (0xff, 0x00, 0x00)
010|
011| ln_spc = 3.2
012| border = 7.0
013|
014| font0 = ImageFont.truetype(‘corbelb.ttf’, size=17)
015| font1 = ImageFont.truetype(‘arialbd.ttf’, size=15)
016| font2 = ImageFont.truetype(‘arial.ttf’, size=14)
017|
These specify the image size (dims) and the coordinate system (view). The c_line and similar variables specify the colors we’ll use. The font# variables are for drawing the digits.
The image creation is very simple:
002| im.border([(0,0,0)], lw=1)
003| # ..
004| # .. do drawing stuff here ..
005| # ..
006| im.save(savename)
007|
This creates an image of size dims scaled per view. The second line adds a one-element black border (drawn with line width of 1). Once the drawing stuff is done, it’s just a matter of saving the image.
The drawing part gets slightly little involved. We’ll take it section by section. Since things we draw later cover things we draw earlier, the order of drawing different parts matters.
The diagonals should look like they’re “beneath” everything else, so we draw them first:
002| iy = (a_len – (b_len–ix))
003|
004| ax = 0 if iy < 0 else iy
005| bx = (iy–1) if iy < 0 else –1
006|
007| p0 = (b_axis[ix], a_axis[–1])
008| p1 = (b_axis[bx], a_axis[ax])
009|
010| im.line(p0, p1, c=c_diag, lw=1)
011|
012| for iy in range(1, a_len–1):
013| ix = iy if iy < b_len else –1
014|
015| ax = 0 if iy < b_len else iy–(b_len–1)
016|
017| p0 = (b_axis[0], a_axis[iy])
018| p1 = (b_axis[ix], a_axis[ax])
019|
020| im.line(p0, p1, c=c_diag, lw=1)
021|
This was the hardest bit of code to work out, and it might be worth a post all on its own. Ultimately it ends up being fairly simple, but the contorted versions I tried for quite some time were pretty ugly.
Moving on, the next layer is the beige roads. Those are fairly straight-forward:
002| p0 = (x, –9.0)
003| p1 = (x, +9.0)
004|
005| im.line(p0, p1, c=c_road, lw=21)
006|
007| s = str(b_digits[ix])
008| im.text((x–0.17, +9.9), s, font1, c=(0,0,0))
009|
010| for iy,y in enumerate(a_axis):
011| p0 = (–9.0, y)
012| p1 = (+9.0, y)
013|
014| im.line(p0, p1, c=c_road, lw=21)
015|
016| s = str(a_digits[iy])
017| im.text((–9.7,y+0.40), s, font1, c=(0,0,0))
018|
The canvas extends from -10.0 to +10.0 on both axes. The roads extend from -9.0 to +9.0 along each center-line. Note that the “road” is just a line with a very fat width of 21.
While we draw the roads, we also draw the factor digits along their respective edges. (Again we assume the -10.0 to +10.0 canvas.)
Next come the lines:
002| ns = b_nlines[ix]
003| if len(ns):
004| for n in ns:
005| p0 = (x+(n/ln_spc), –9.0)
006| p1 = (x+(n/ln_spc), +9.0)
007| im.line(p0, p1, c=c_line, lw=2)
008| else:
009| p0 = (x, –9.0)
010| p1 = (x, +9.0)
011| im.line(p0, p1, c=c_null, lw=3)
012|
013| for iy,y in enumerate(a_axis):
014| ns = a_nlines[iy]
015| if len(ns):
016| for n in ns:
017| p0 = (–9.0, y+(n/ln_spc))
018| p1 = (+9.0, y+(n/ln_spc))
019| im.line(p0, p1, c=c_line, lw=2)
020| else:
021| p0 = (–9.0, y)
022| p1 = (+9.0, y)
023| im.line(p0, p1, c=c_null, lw=3)
024|
Note the special handling of empty lists, which represent the digit 0.
Note also that, as with the roads, the lines extend from -9.0 to +9.0 across the image. The parallel their center-line axis adjusted by the offset.
One last section to draw the group counts (which overlie the lines):
002| for iy,y in enumerate(a_axis):
003| a = a_digits[iy]
004| b = b_digits[ix]
005| im.text((x,y), str(a*b), font2, c=(0,0,0), bg=(255,255,255))
006|
007| s = ‘%d x %d = %d’ % (a_nbr,b_nbr,c_nbr)
008| im.text((–9.0,–9.1), s, font0, c=(255,0,0))
009|
Those last lines draw the multiplication and product along the bottom edge.
And that, almost surprisingly, is all there is to it.
§
Two things remain. Firstly, I’d like better spacing when there are only two digits. Right now, the two place at the outside edges. They should be closer in.
Secondly, rotation. I’m thinking of a version that generates the points, transforms them through a rotation matrix (or using a quaternion) and does the drawing with the transformed points. It’s all just point-to-point lines, so it should work fine. Then I’ll have images that look like the Japanese method.
Ø

Okay, the rotation part turned out to be super easy:
I just added a rotation matrix and a function to translate coordinate points.
Two extra lines of code (three including the matrix class import line), and adding a function name in front of what were already pairs of coordinates in parenthesis. The function takes a pair of XY coordinates and returns a transformed tuple.
Now about the two-digit spacing…