
Tags
baseball, character graphics, computer programming, imperative programming language, Minnesota Twins, programming language, Python code, Target Field
One of the cool things about being a carpenter is that you can make your own shelves and dog houses. One of the cool things about being a computer programmer is that you can make your own computer apps!
In an era when computers are so much a part of life, that’s a useful skill. And the nice thing about doing it yourself is that things turn out exactly as you want them. You can make things that are perfect just for you.
Case in point: using Python to create custom charts of baseball stats!
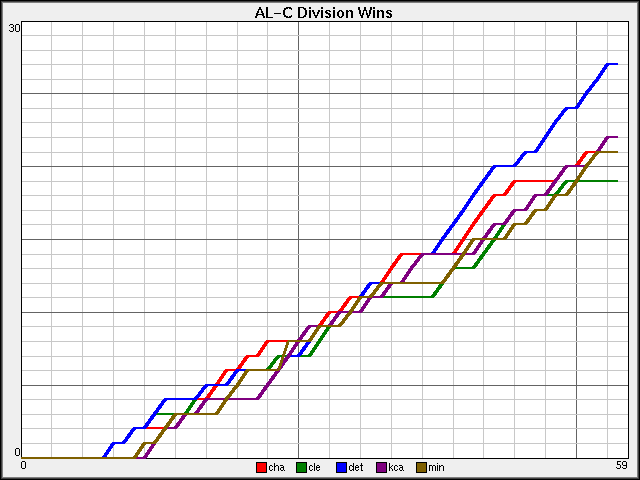
Wins for the American League Central teams so far. The Tigers are quite a ways ahead of the rest of us!
First at bat: Python!
Python is a delightful programming language that first appeared in 1991. At heart it’s an imperative programming language, but it does have an object-oriented model. I’m not in love with the object-oriented model, although I do make pretty heavy use of it. But Python’s OOP model is a post for another time. For now I want to just mention some of the things that make Python so cool.
As with many modern languages, Python does its own memory management and garbage collection. The programmer doesn’t allocate data space or release it. And because Python manages data, buffer overruns are not an issue. Putting data management “behind the scenes” (or “under the hood” if you prefer) makes any language easier and more comfortable. It also removes the source of many code bugs.
Python is a “list” language; lists are native data elements. Of course this means Python also has powerful commands for working on lists.
Functions are native elements in Python (which lets you to use it for functional programming). It’s amazing what you can do in languages that allow you to pass functions as parameters! (Functional programming is a twisty way of writing code that I’ve never completely wrapped my head around.)
The icing on the cake is that scope (code blocks) in Python are done with indenting! There are no curly braces, as in the C-family of languages. There are no BEGIN and END keywords, as in the Algol families. It’s all done with indentation, which good programmers use anyway. Not having to use block delimiters or keywords makes the language look clean. It looks a lot like most programmers’ pseudo-code (a kind of shorthand programmers use for scribbling down code ideas).

Number of games back (so far) for teams in AL-C. The winning team is flat-lined at the top and the other teams are below accordingly.
Next up: Image Generation
I’ve always had some interest in CGI — in this case that means Computer Generated Images (not Common Gateway Interface). In the very early days (the 80s!), with the IBM PC and the Commodores 64 and 128, I wrote graphics libraries (sometimes in BASIC, sometimes in assembly) that used character graphics to simulate a crude windowing environment. Those of you who know what “character graphics” is will smile with nostalgia.
For those of you who don’t, it was a very early form of windowing that bridged from (and used!) the original text interfaces. Many of you will have never experienced it. It predates true bitmapped graphics and windows. In many cases, it even predates mice! (My Commodores had joysticks for gaming, but no mice.) By modern standards, character graphics is impossibly quaint!
Later, as displays improved, the early BMP images gave way to GIFs and then JPEGs (and now PNGs). In the 90s, I downloaded and used libraries that let me create GIF images on the fly for my website. “Hit Counters” were popular back then, and I wrote a utility that generated counter images in a variety of formats, from LED to Odometer to Nixie Tube. (If you know what a Nixie tube is: You. Are. Old. (And very geeky.))
More recently, it’s been POV-Ray (a high-level 3D rendering app) and Java 3D (which can create live 3D environments). The technology — and the fun you can have — just keeps getting better and better.
Recently I’ve been wondering if there wasn’t a Python library for graphics that would let me continue exploring the world of image generation in Python. I figured that, of course there would be such a library. It was just a matter of seeking it out, downloading it, learning to use it and then putting it to good use. It’s something that’s been in the back of my mind for a while now. I finally got around to checking it out.
Turns out the Python Image Library (PIL) is freely available (just like Python), trivial to download and install, and as easy to use as pie. [Actually I don’t like pie, so I’d like to propose an alternate saying: “As easy as cake!” Which is to say quite easy, although you do need some fork skills as well as sufficient dexterity to transport the cake (or pie) to your mouth.]
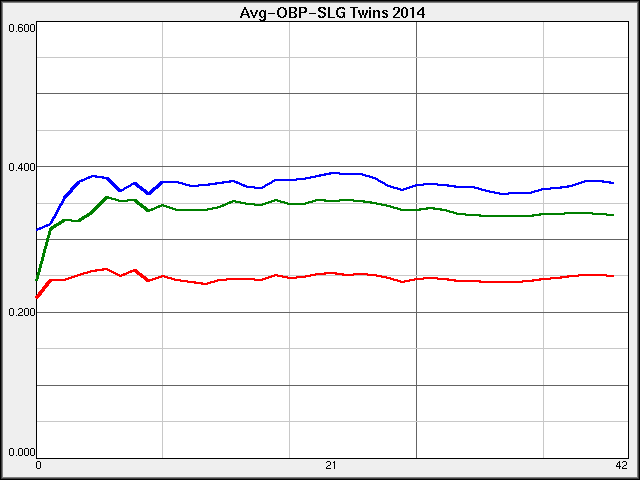
Team batting average (AVG), on-base percentage (OBP) and slugging percentage (SLG) for the MN Twins.
Which brings us to: Baseball
See, one of the main reasons for wanting to be able to create images is wanting to create certain types of baseball stat charts. Computer graphics has turned out to be an amazing tool for visualizing data. Not only do computers naturally do all the fiddly, tedious calculations necessary, they display the data in extremely useful ways.
What I did for quite a few years is use Python to generate (TAB-delimited) files of tables that I imported to Microsoft Excel where I could use Excel’s power to make a variety of very nice graphs and charts. That’s a manual process, so it was a little tedious. I could use Excel to automate a lot of that, but it’s still a two-step process. Since I retired I no longer have free access to the Microsoft office suite, so I can’t make those charts anymore.
[I’ve been considering that, for my next PC, I’ll either pay for personal MS Office or perhaps finally investigate Open Office, which I understand is just about as good. Since I don’t use many of the really advanced features (especially in Word), that might work out very well.
What I’d really like is for my Python code to create images directly. That was the goal of the recent effort. (I was having so much fun, I was up until after 5 AM. Twice!) I no longer have Excel to do any of the work on axes or legends, so I have to write code to draw everything. The old-fashioned DIY programmer in me is okay with that, but the programmer in me whose done that stuff for forty years would just as soon not.

Attendance at Target Field (home of the MN Twins) since it opened in 2010. As you can see, the opening season (where we did make it to post-season) and the following year had high attendance, although it begins to fall off at the end of 2011 (a bad year for the Twins). Each year since has worse attendance, like due to the awful performance of the team the last three years. This year, with very low team expectations, it start off low, but is climbing. That could be due to summer finally showing up, or could be due to a growing perception that the Twins aren’t quite as bad this year as in the last three!

FTR: A couple of years ago I switched from generating my own charts (pixel by pixel) with PIL and started using MATPLOTLIB, which is awesome-double-plus-squared. It makes the charts so much better (not to mention incredibly easier)!